Linux IoT Device Data Monitoring – How to guide
The Internet of Things concept is all about doing things remotely. In industrial environments such as a manufacturing plant or a worksites, agricultural fields etc., it’s increasingly becoming popular to use remote monitoring tools to monitor sensor data (percentage humidity, temperature) and many more parameters obtained by sensors connected to linux devices far away from you. Sometimes, it can even be a parameter that’s directly bound to the Linux edge devices in the field such as a variable within the hardware or the software of the device such as USB device connectivity status. Regardless, the data that can be retrieved from those edge devices play a significant part in remote linux device monitoring, which can be used to analyse the conditions and make decisions accordingly.
So, wouldn’t it be nice to have a feature that allows you to monitor data coming from your remote Linux device, and maybe set some alerts (an Email, dashboard notification etc.) if a certain type/value of data is observed?
If you’ve been following up with the previous articles about JFrog Connect remote edge Linux IoT device management platform, you might already have a good understanding of how useful our platform can be when it comes to both industrial/commercial and personal projects. Today in this post, we’ll be discussing one of our Remote Monitoring tools, the Data Monitor, which can be a very powerful remote data monitoring tool for your applications.
The JFrog Connect Data Monitor Tool
JFrog Connect device management platform is an all-in-one platform for Controlling, Managing and Monitoring your linux-based IoT edge devices from anywhere in the world. To the left side of your dashboard, you can find the Data Monitor tool under the Monitor section to help you monitor data coming from your Linux device. This tool allows you to monitor data being sent from your linux IoT device or any other Linux-based remote IoT device conveniently using our Platform.
The JFrog Connect Data Monitor uses HTTP POST requests using an ID-Token pair which is unique to your device running JFrog Connect agent. The API can be called through any program written by any programming language, given that the language supports HTTP POST/GET requests and JSON objects handling. For the sake of simplicity, we’ll be using Python to send some data from your Linux Device to cloud IoT platform through HTTP POST request.
Before beginning, make sure that you have enrolled your device to your JFrog Connect dashboard and if not, follow this guide to quickly enroll your linux device.
Step-by-Step guide for Remote Data Monitoring
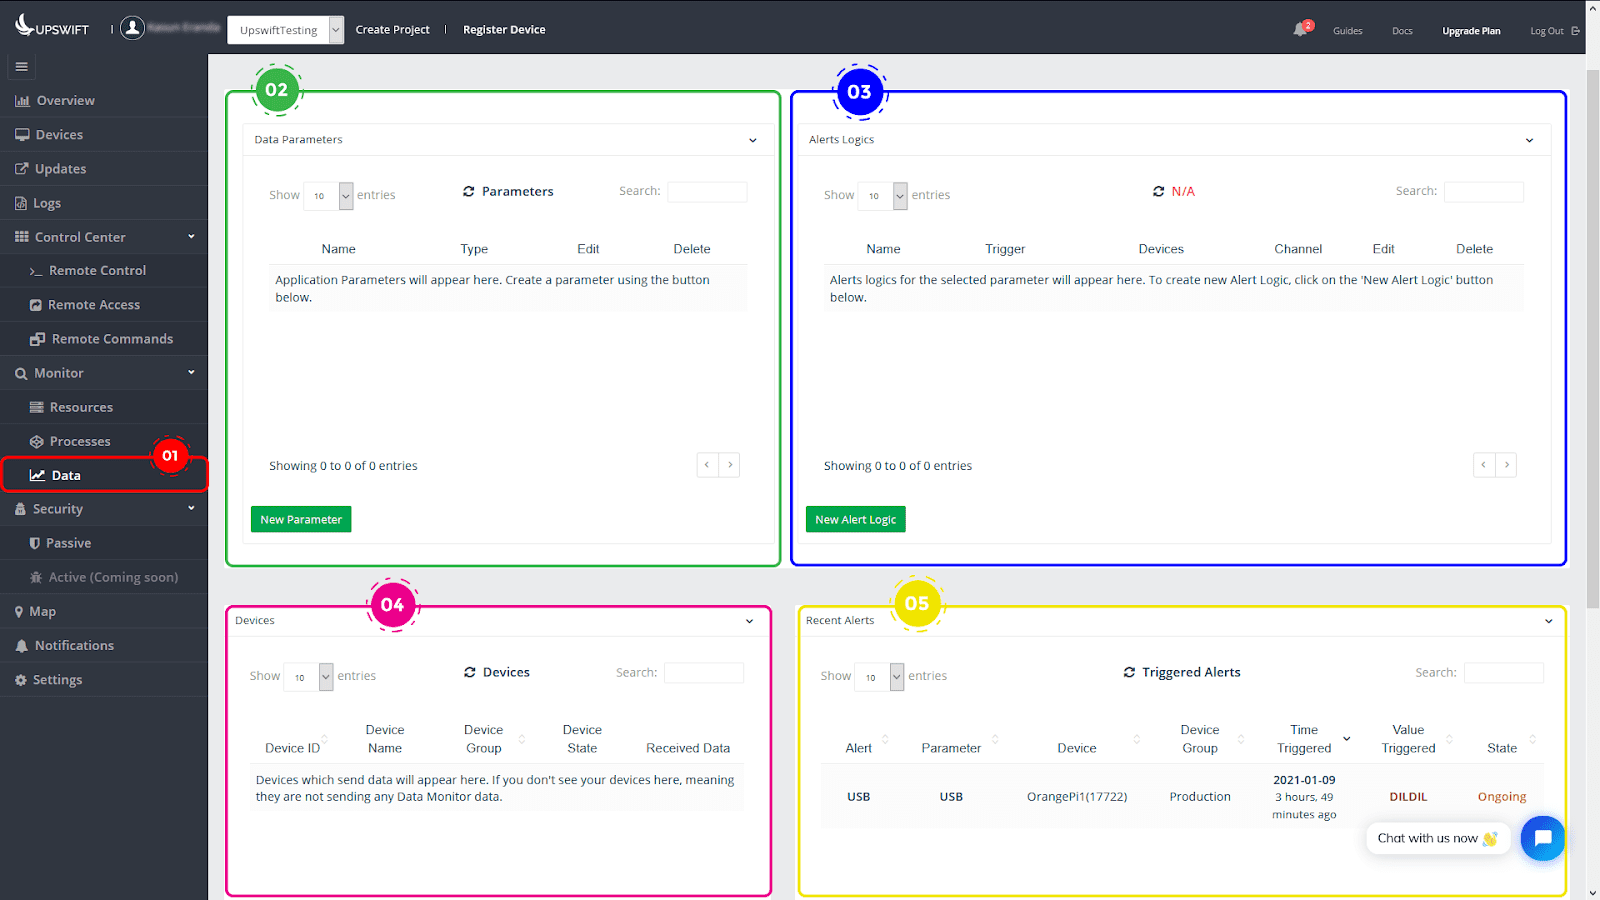
- Go to Data Monitor Dashboard
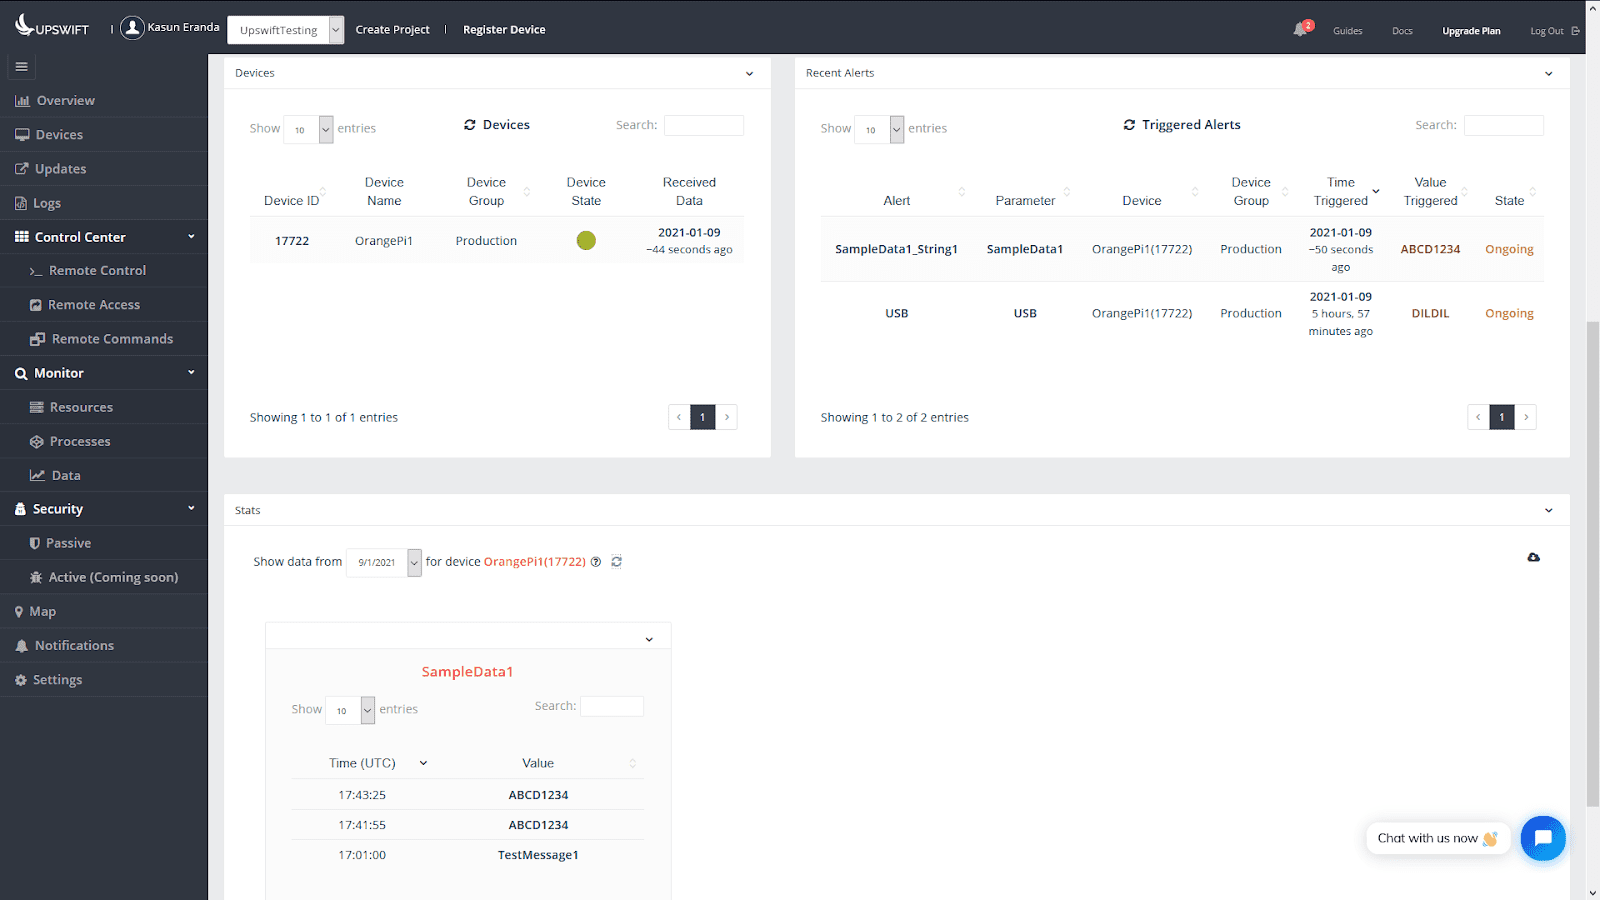
Go through the Navigation Pane -> Monitor -> Data to reach the JFrog Connect Data Monitor dashboard. Here you will find the necessary sections to setup Data Parameters, Alert Logics, and view data from Devices and Recent Alerts.
- Add new parameter to observe
Click ‘New Parameter’ and provide a name for your parameter. And provide a data type for the dashboard to expect from that parameter name. The following example shows a parameter names ‘SampleData1’ and it’s data will be of type ‘String’.
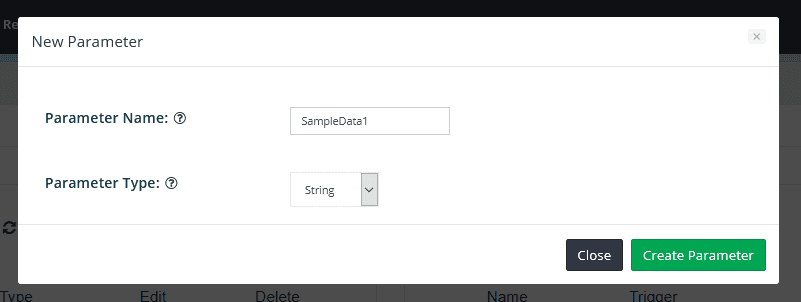
Click Create Parameter and confirm to create the item.
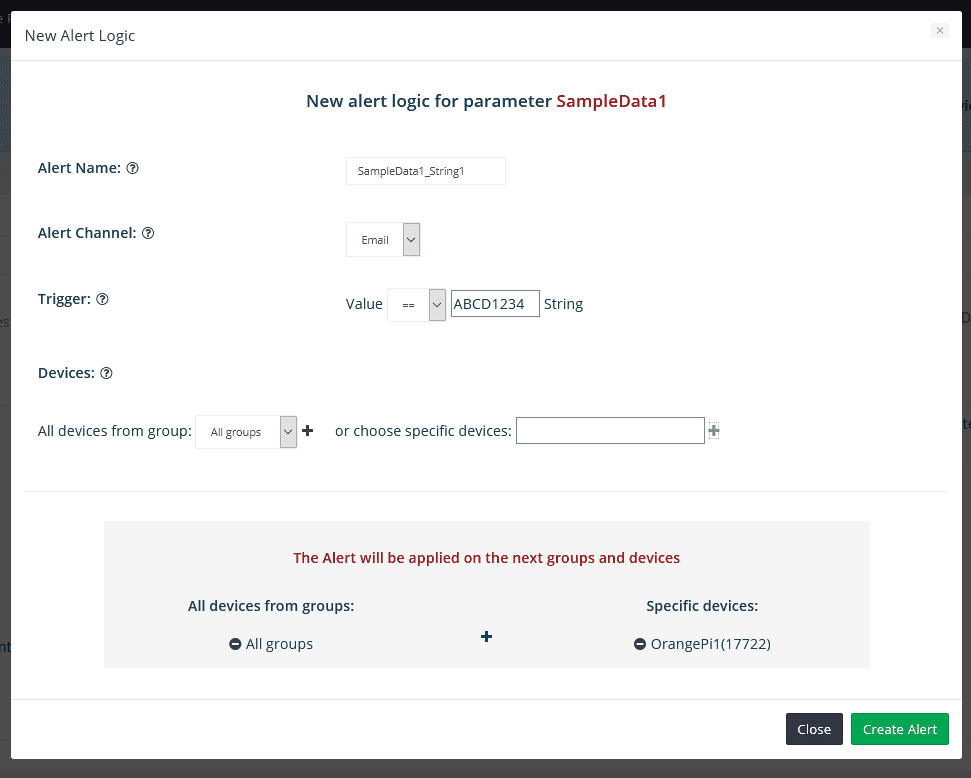
3. Add new alert logic(s) [optional step]
In order to be notified about certain data, you can set ‘alerts’ through the Alert Logic section. The received data from a specific parameter can be compared with a predefined value and alerts can be setup to trigger upon matching.
4. Sending data to JFrog Connect Data Monitor from your Linux device
Now that the dashboard side is set up and configured to receive data from your Linux device, let’s send some actual data from your device to your dashboard. To do this, you need to call the API https://api.upswift.io/v1/send_app_monitor with a JSON object following the below format:
- <device_token> and <user_token> can be found in your device’s JFrog Connect service settings file at </user_token></device_token>/etc/upswift/service/settings.json
- <parameter> name must match the parameter you created in </parameter>Step 2
- <content> should be in the format you specified when creating the parameter in </content>Step 2
Instead of manually fetching tokens by yourself, you can automatically obtain them through the script itself as well.
A complete example script written in Python is as follows:
5. Run the script!
When you execute the script, if everything is correct, you will be able to see the data sent from your device under the Stats section in the JFrog Connect Data Monitor Dashboard.
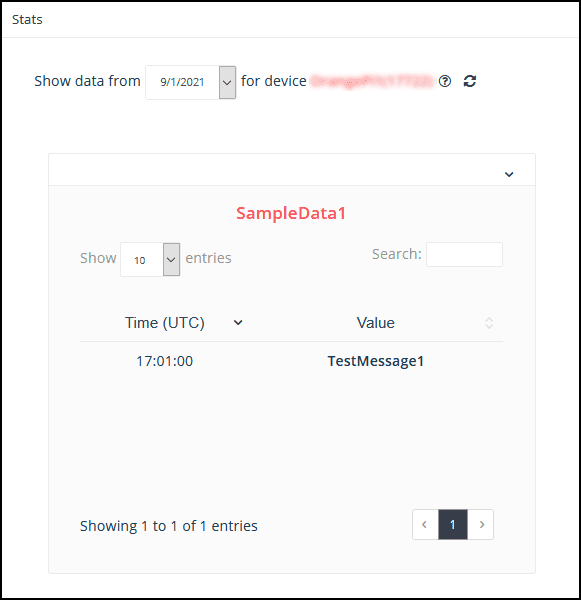
Additionally, the Device section shows information about the telemetry data from each device that sends data to the Data Monitor, and Recent Alerts show the triggered alerts according to the ruleset you may have specified.
Use cases of Remote Data Monitoring on edge Linux IoT devices
You can use this feature to monitor all kinds of data that can be embedded into a JSON object. Typical use cases where you can use this includes:
- Remote temperature and humidity monitoring in smart gardening systems obtained through different sensors connected to your linux edge devices
- Industrial process monitoring such as manufacturing lines and quality checking parameters etc.
- Remote data collection from linux edge devices such as performance data and resource data, generated by applications running on the device
- Monitoring the hardware and status software of the devices
and the list goes on and on.
Conclusion
The JFrog Connect Data Monitor tool is one of the most used tools in the JFrog Connect linux remote IoT device management platform to monitor data being sent from linux edge devices. With this tool, you can set up alerts on data being sent to the dashboard to keep and eye on any irregularities in the data to make sure that your IoT devices are functioning as intended.
The Remote Data Monitoring tool is just one feature JFrog Connect offers. Interested in what else JFrog Connect might have to offer? Visit JFrog Connect and sign up to get a first-hand experience on our next generation Edge Linux IoT Device Management platform!


