Raspberry Pi Monitoring with JFrog Connect IoT platform
Monitoring Raspberry Pi can be a tiebreaker in some cases. When developing a smart IoT device, usually after deployment maintenance is totally forgotten, despite that in most situations it is more essential than any other thing.
I will go through the most simple, yet powerful way that let you monitor your Raspberry Pi, or any other Linux-based device.
Using this guide, you will be able to remotely monitor your Raspberry Pi’s CPU/RAM usage, as well as any other custom parameter you would like, in a few minutes.
1. Register to JFrog Connect IoT management platform, it is completely free for Makers and personal use.
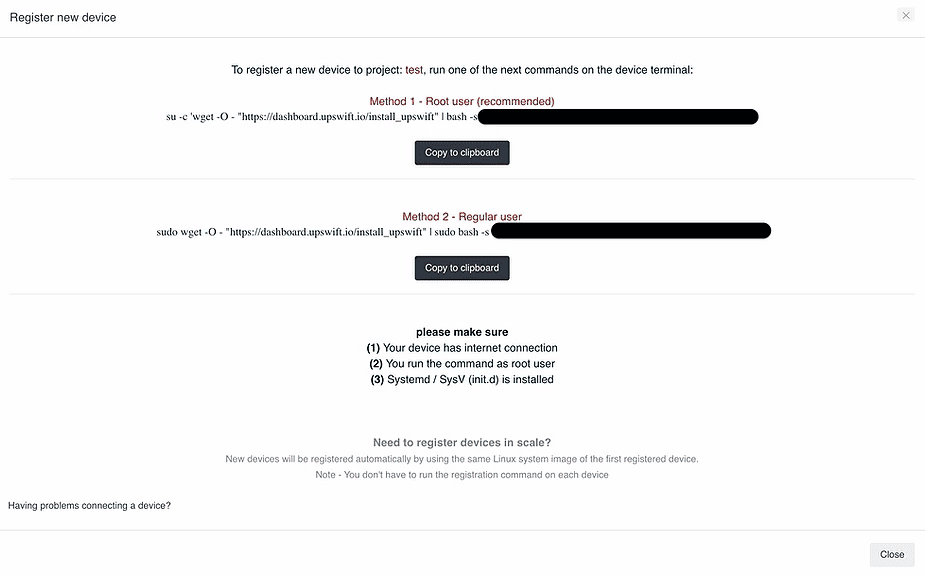
2. Login to the dashboard, create a project and register your Raspberry Pi to the platform. Click on ‘Register Device‘ link at the top of the dashboard, then copy the registration command and run it on your Raspberry Pi’s terminal. Your Raspberry should appear at the ‘Devices‘ category in a minute.
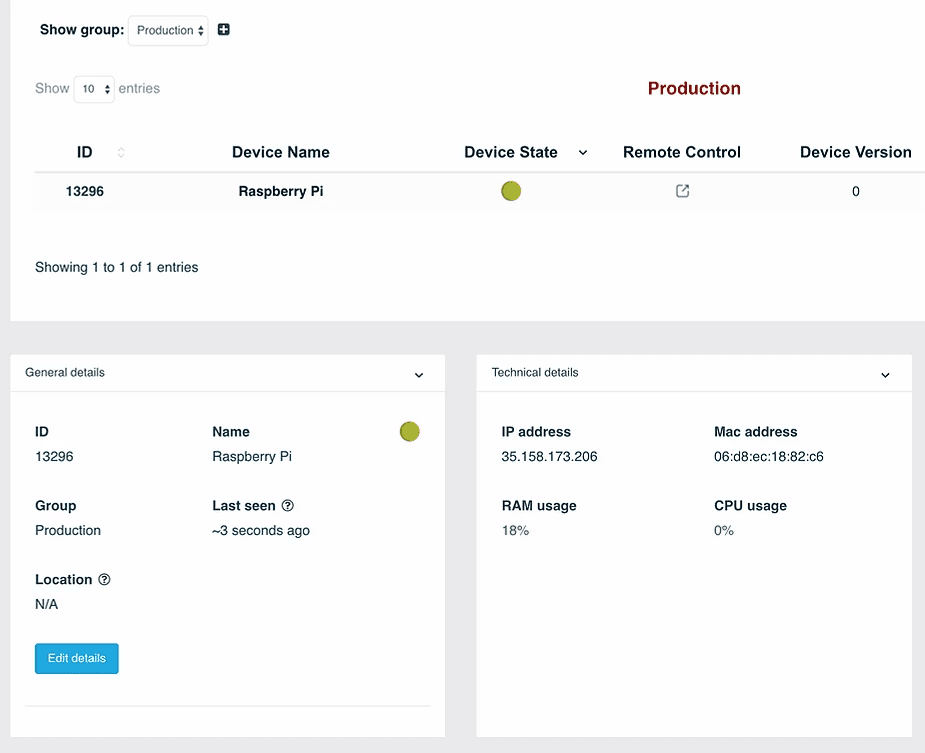
3. Monitor resources – Click on your Raspberry Pi that has been recently appeared. You will notice that multiple boxes are shown under the devices table. You can clearly view at the ‘Technical details‘ section your device’s real-time resources usage – RAM / CPU. Keep in mind that they automatically refresh, hence the value you see is approximately in real-time.
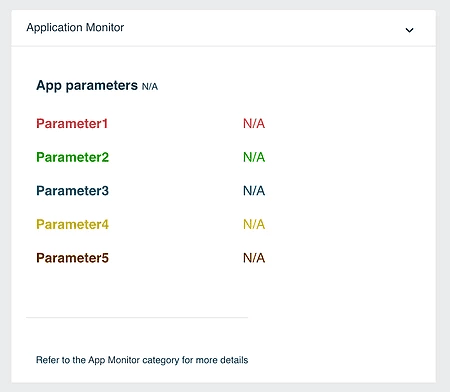
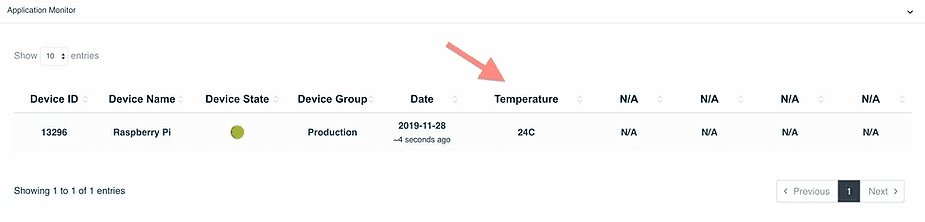
4. Monitor custom parameters – If you take a look below the ‘Technical details‘ section, you will see another one called ‘Application Monitor‘. At the moment, you should see 5 empty parameters. Let’s configure them by clicking on the ‘App Monitor‘ category on the left menu.
The parameter I will take as an example for this guide will be a Temperature value I receive from a sensor connected to my Raspberry Pi board.
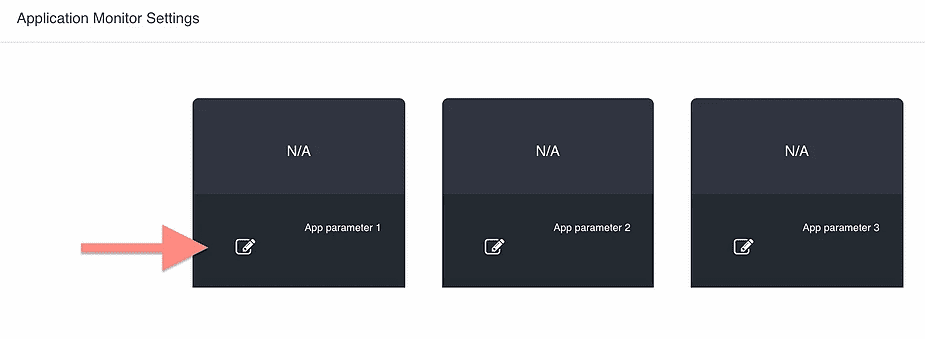
First, let’s change the parameter name to: Temperature. To do so, click on the ‘edit’ button at the first parameter box:
Now, we have to send that parameter value from the Raspberry Pi to JFrog Connect’s dashboard. Let’s connect to the Raspberry Pi terminal using the Remote Control tool (go to ‘Devices‘ category and click on the ‘Remote Control‘ button at your Raspberry Pi row).
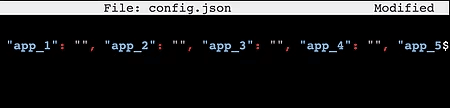
When connected, navigate on the Pi terminal to /lib/upswift/ and open the JSON file named config.json. You will notice there are 5 keys named: app_1, app_2, … , app_5. Each one of them represents the equivalent parameter at the dashboard. JFrog Connect service samples that file occasionally and sends the value of those parameters to the dashboard.
I will configure my application to open that file and update the app_1 value with the value I receive when sampling the temperature sensor.
As soon as I update that file, I can see the temperature at the dashboard:
Basically that’s it. You can configure more parameters, as you wish, and view 7 days history of their values.
The ‘Application Monitor‘ tool is pretty robust and configurable. You can send from your application whatever value you would like to have, it can be an Integer as well as String.
Have fun monitoring your Raspberry Pi!


