Introduction to the JFrog Connect Linux Process Monitoring Tool
Within this extremely useful toolkit, there’s the Process Monitoring Tool under the Monitor section, which allows you to set rules to send you alerts about the status of process(es) running in your Edge Linux IoT Devices. This feature comes handy when you need to monitor a specific service/process, need to be running persistently and to be notified promptly of any interruption to it if and when such an event occurs. (i.e. an MQTT broker going offline abruptly or the execution of a specific process such as web browsers or media players etc.)
Setting up an alert for a specific process has been made a very straightforward and streamlined process by splitting the process into three main steps, which starts with getting to the configuration page.
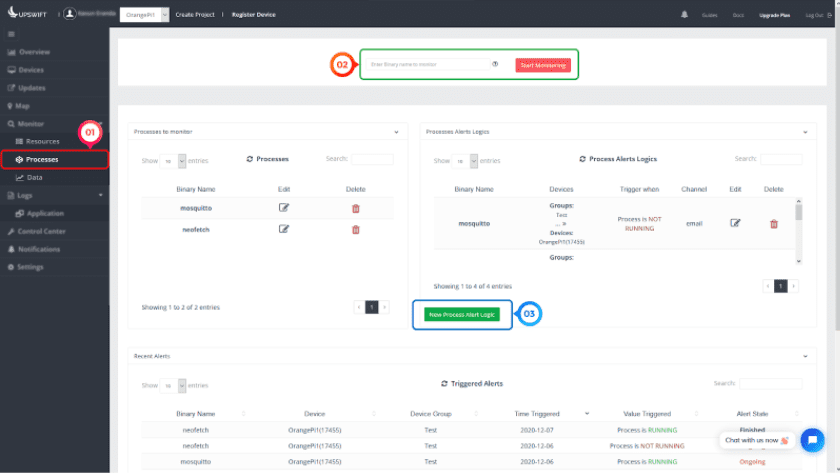
- Process Monitor Dashboard
Go through the Navigation Pane -> Monitor -> Processes to reach the JFrog Connect Process Monitor dashboard. There, you’re provided options to configure the existing Process Monitor Rules and their relevant Process Alert Logics.
To the bottom of the page, there’s a list of triggered alerts which indicates which alerts have been triggered by which process, and on what condition.
- Enter the Process Name to Monitor
Here, you are required to enter the name of the process to be monitored (i.e. firefox, vlc, mosquitto etc.) This can also be a python/bash script, which needs to be entered in full file name (i.e. main.py, run.sh etc.)
Entering a process name here and clicking the Start Monitoring button adds the process into Processes to monitor section.
- Set Process Alert Logic
After adding the process, clicking on the New Alert Logic button will bring up the following window, where you can customize the alert with a number of options to choose from
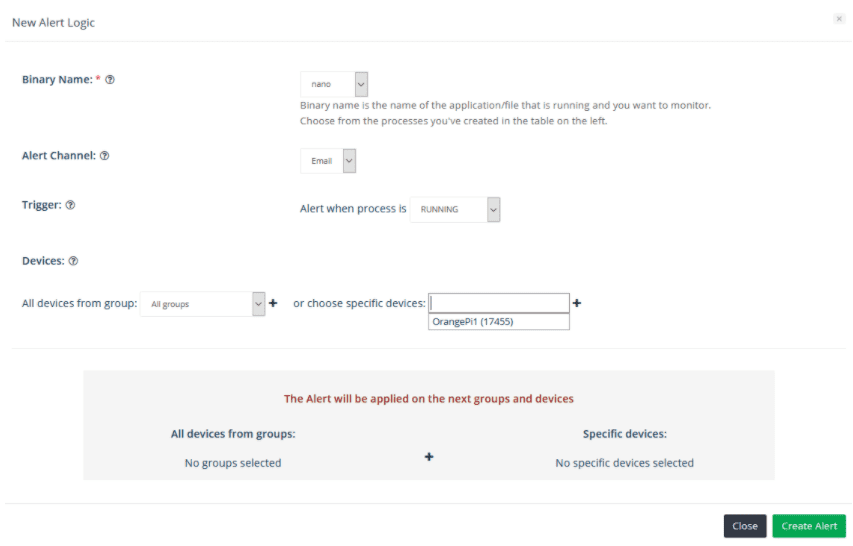
- Binary Name – Select one from the previously added binaries list to which the rule will be applied
- Alert Channel – Email or Dashboard Notification (depends on the plan and permissions)
- Trigger – Alert when Running or Not Running
- Device Group – choose which device/set of your edge linux IoT devices are subjected to the rule being set (select from the list and click the ‘+’ sign next to the drop down list to add it to the rule)
And hit the Create Alert button to apply the changes.
And that’s it! Now sit back and relax while JFrog Connect monitors the process(es) and if one or more of the rules are triggered, you’ll be notified right away!
If you visit the Device Overview section through the Navigation Menu -> Devices, the monitored processes will be shown under the Technical Details pane, along with their running statuses.
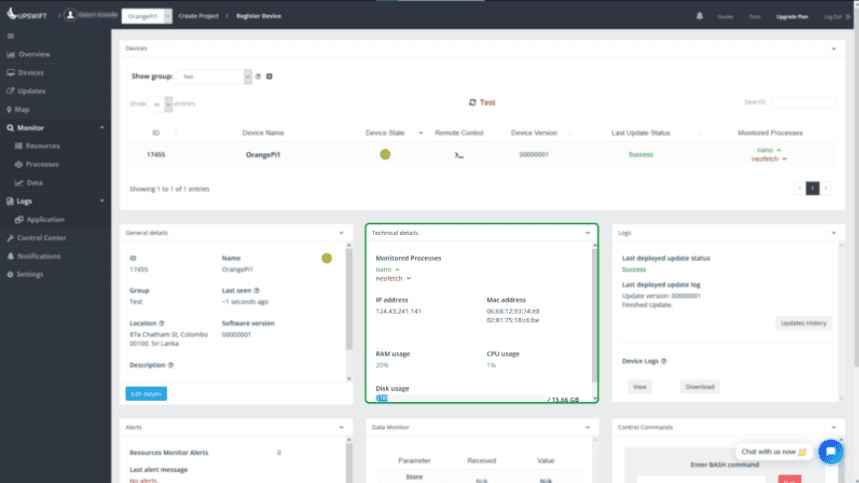
This let’s you have a quick glance at the monitored process and easily observe the Running/Not Running stats. For more detailed information, you can always go to the Monitor -> Processes section and the real-time information will be right there, at your disposal.
The Remote Process Monitoring tool is just one feature JFrog Connect offers. Interested in what else JFrog Connect might have to offer? Visit JFrog Connect and sign up to get a first-hand experience on our next generation edge Linux IoT device management platform.


