Why we need JFrog Connect Diagnostics engine when managing a fleet of IoT edge Linux devices
Managing a fleet of IoT edge Linux devices remotely can be a tough mission, there’s a lot of technological considerations we should do to make sure our edge devices have the best maintenance capabilities when they are in production and far away from “home”.
Diagnostics capabilities are just one of those tools we understood here at JFrog Connect that you must have when you manage a fleet of products running your software all over the world. When we develop an IoT product, there’s a lot of testing which has to be done before going out to production. In most cases, even after we did our best with those checks and tests, we will probably find out things that don’t work as we wanted for the first time. Things that we didn’t expect could happen like software Logs files that eating the device storage or software bugs which can be caused just in production and have to be solved quickly.In other situations, you may just want to deploy a software update remotely and have a good way to understand if the device behaves well even after months. Maintaining IoT devices without a Diagnostics engine may cause big problems in the product future which can be ended with product recalls.
How JFrog Connect Diagnostics engine make sure that your edge devices safe and stable?
JFrog Connect Diagnostics engine divided into 2 separate diagnostics systems – System and Application. Together, those engines responsible for the whole device behavior at any given moment.
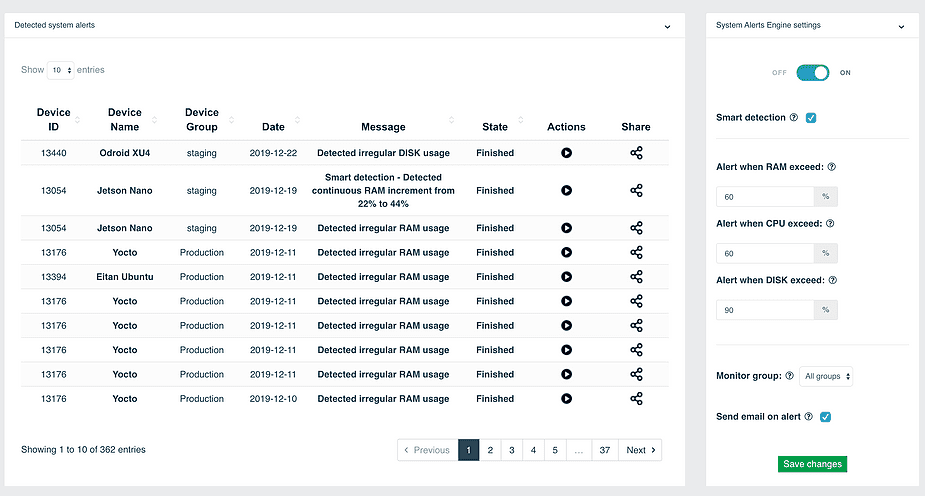
The System Diagnostic engine enables you to monitor and receive live alerts of the device resources by a set of restrictions and rules which will determine when to send a new alert.
For example, by setting a limitation of 75% for the device disk size, you will get an alert notification when one of your edge devices passing this limit and you will immediately be able to understand the reason for the limit passing by starting a remote control session and debugging the running code, or by reading the logs of your application.

Here in the picture above, we can see great examples of system alerts that came from different devices and exceeded the limitations which have been defined. Another great functionality for keeping our edge devices safe is the Smart detection function which comes in to play in the second row where the device named ‘Jetson Nano’ is automatically getting alerts on a strange RAM incremental that is detected.
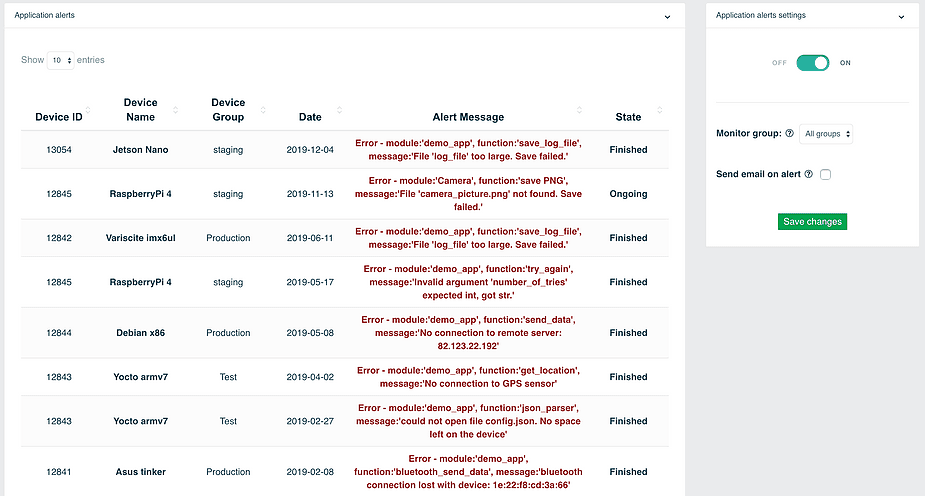
The Application Diagnostics engine enables you to send live errors and alerts from the edge device application to JFrog Connect platform. Those messages will show up at JFrog Connect Application Diagnostic table arranged by date, and with the current state of the massage (Ongoing or Finished). Those messages can be sent by setting up a simple JSON file value under JFrog Connect agent directory on the device file system.

In the picture above, we can see how the Application alert helps to understand what errors and software bugs currently affect specific devices. In the second row, there is a great example of a device named ‘Raspberry Pi 4’ which is sending a message alert regarding the device camera and still on an ‘ongoing’ state, which means that the error is still happening.
JFrog Connect IoT device management platform provides the best remote maintenance capabilities and features especially for IoT products and edge device which is running Linux.


